
KPI pack
Product sample · 1 of 3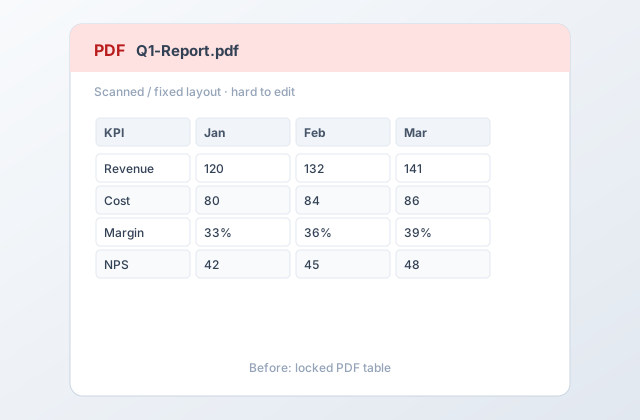
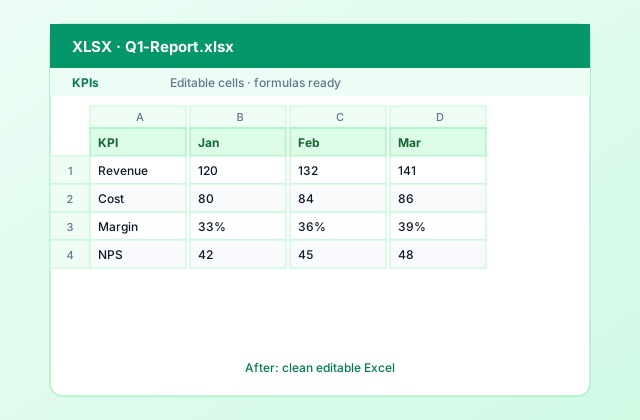
Dense KPI table → filterable, chart-ready Excel.
Transform report tables and KPI grids into editable Excel workbooks for analysis and sharing.
Converted file is ready for full download.
Secure checkout opens in a new window. Your converted file stays here.
The Before/After images below are illustrative product samples for financial reports documents. They are not generated from your uploaded file.
Dense KPI table → filterable, chart-ready Excel.
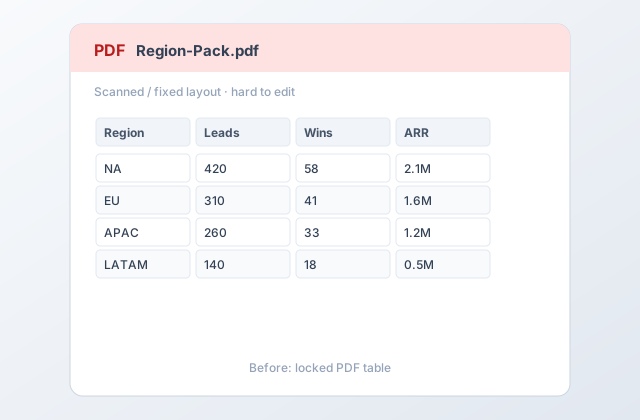
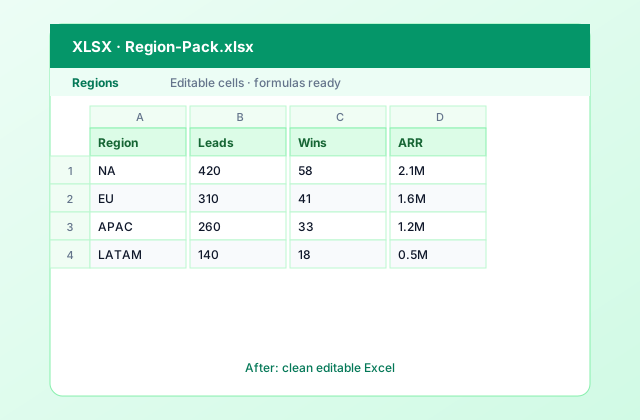
Leads / wins / ARR by region in clean columns.
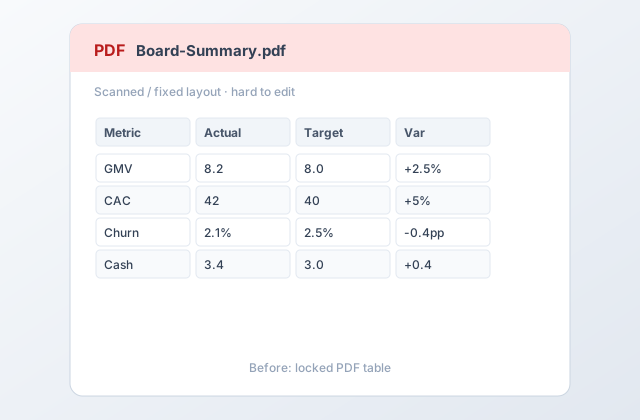
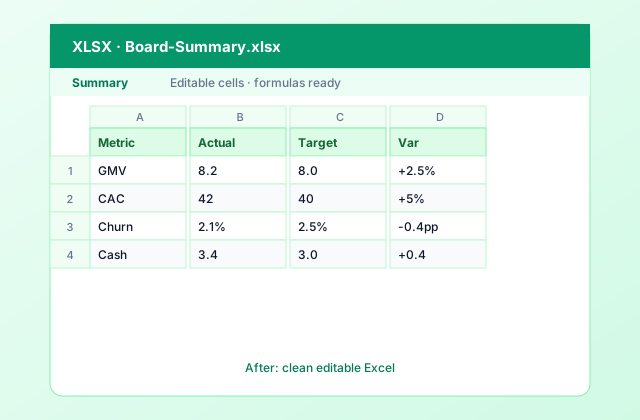
Actual vs target metrics exported for analysis.
Focused on dense report tables, metrics, and multi-section layouts.
Capture multi-column report grids with fewer broken cells.
Keep headings and values readable after export.
Convert scanned report pages into spreadsheet data.
Open in Excel and start filtering or charting immediately.